Sam Page
← All thinking

I'm held at a red signal on the train...

Customer experience2 min readSam Page

so I've decided to use Claude Cowork to work out the odds and produce a few charts. Here you go ... (not expecting many thanks for this one).
From the latest figures (2024):

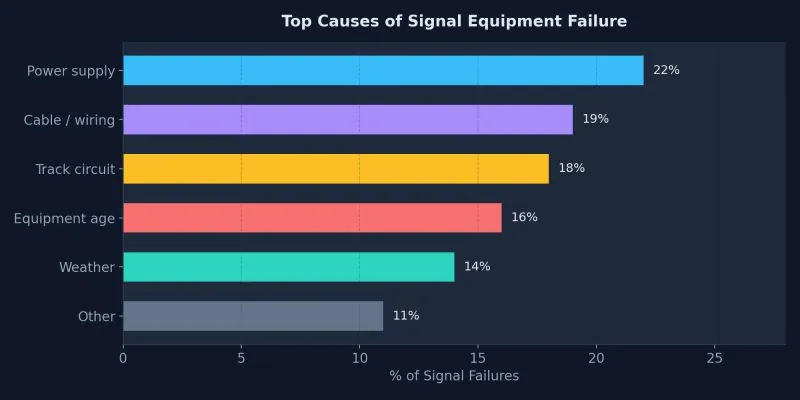
Part 1: Signal equipment failures (the hardware breaks)
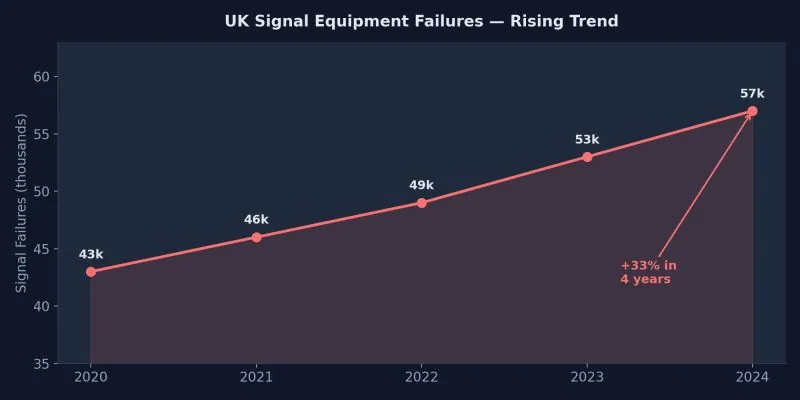
57k signal failures occurred across the UK (Network Rail data).
+33% since 2020 - aging infrastructure, constrained renewal budgets.
Affecting 192,647 train services and causing ~23,000 hours of total delay.
7.5 million planned train services per year (ORR data)

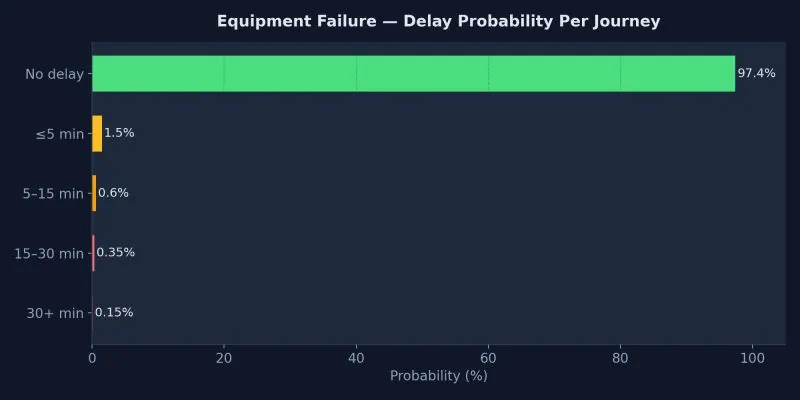
The chance of any train being hit by an equipment failure:
192,647 ÷ 7,500,000 = ~2.6%

That's roughly 1 in 40 journeys

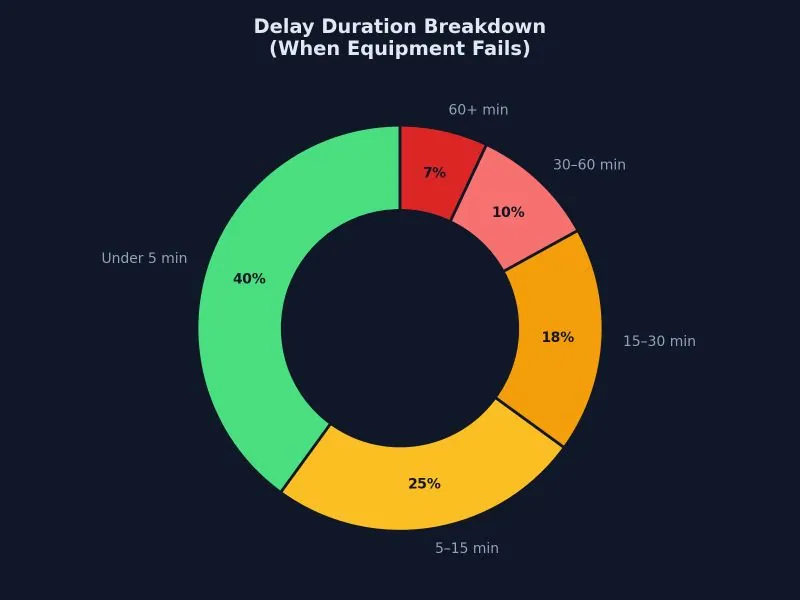
The average delay per affected train:
23,000 hours ÷ 192,647 trains = ~7.2 minutes

For a daily commuter doing ~480 journeys/year:
~12–14 short delays and ~7 longer ones from equipment failures alone

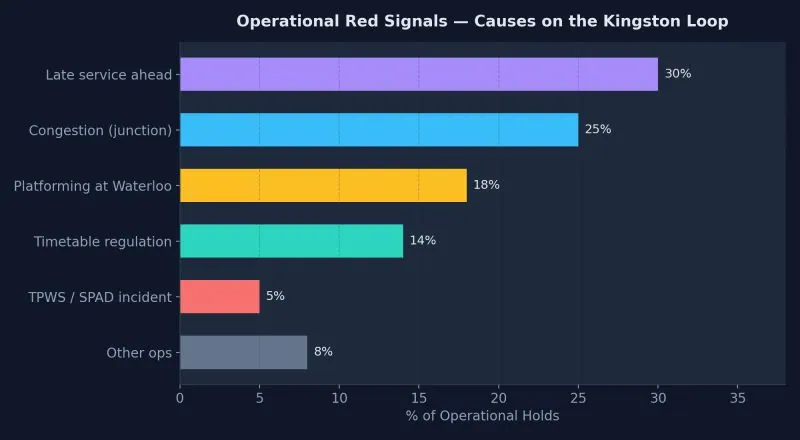
Part 2: Operational red signals (the signal works, but it's red anyway)
This is where the signaller holds your train for traffic management.

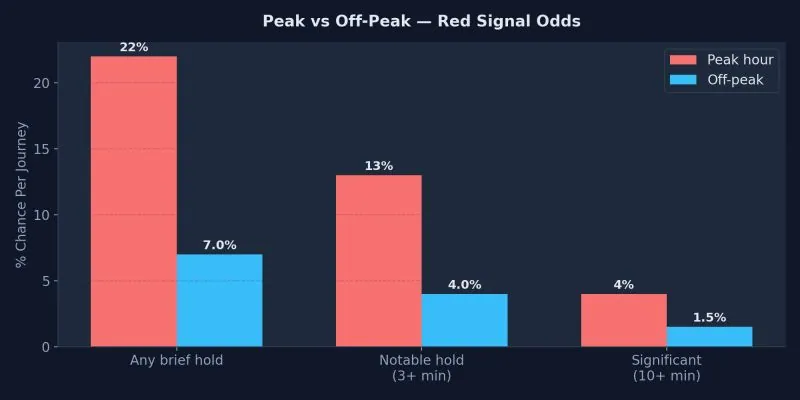
On a busy commuter route like the Kingston loop, this happens on an estimated 15–25% of peak-hour journeys to some degree (derived estimate from ORR data)

Most are brief (1–2 minutes while a service clears ahead)

A hold of 3+ minutes happens on roughly 10–15% of peak journeys (derived estimate from ORR data)

The main hotspots: Clapham Junction (one of the busiest junctions in Europe), Wimbledon (convergence of multiple routes), and Waterloo approach (platform availability)

Off-peak, operational holds drop to roughly 5-8% of journeys

Part 3: Combined - my actual odds
Equipment failure delay per journey: ~2.6% (1 in 40)
Red signal hold per peak journey: ~15–25% (any hold), ~10–15% (notable)

Combined chance of any meaningful red signal stop (3+ min, peak): ~12–17%
Combined chance of a completely smooth run (peak): ~72–82%

Over a commuting year (480 journeys): expect roughly 70–85 journeys with some kind of red signal hold, of which ~20 will be 10+ min.

First published on LinkedIn.

More on customer experience

One email, every Friday.

What happened this week, what I'm thinking about, and one takeaway for yours.

GEThttps://sam-page.com/thinking/im-held-at-a-red-signal-on-the-train.mdtext/markdown; charset=utf-8

---
title: "I'm held at a red signal on the train..."
url: https://sam-page.com/thinking/im-held-at-a-red-signal-on-the-train
date: 2026-02-26
author: Sam Page
type: Post or article
categories: [Customer experience]
reading_time: 2 min
summary: "so I've decided to use Claude Cowork to work out the odds and produce a few charts. Here you go ... (not expecting many thanks for this one)."
first_published: https://www.linkedin.com/feed/update/urn%3Ali%3AugcPost%3A7432795518268911616
---

# I'm held at a red signal on the train...

so I've decided to use Claude Cowork to work out the odds and produce a few charts. Here you go ... (not expecting many thanks for this one).
![](https://sam-page.com/img/thinking/im-held-at-a-red-signal-on-the-train-li1.webp)

![](https://sam-page.com/img/thinking/im-held-at-a-red-signal-on-the-train-li2.webp)

![](https://sam-page.com/img/thinking/im-held-at-a-red-signal-on-the-train-li3.webp)

![](https://sam-page.com/img/thinking/im-held-at-a-red-signal-on-the-train-li4.webp)

![](https://sam-page.com/img/thinking/im-held-at-a-red-signal-on-the-train-li5.webp)

![](https://sam-page.com/img/thinking/im-held-at-a-red-signal-on-the-train-li6.webp)


From the latest figures (2024):

Part 1: Signal equipment failures (the hardware breaks)  
57k signal failures occurred across the UK (Network Rail data).  
+33% since 2020 - aging infrastructure, constrained renewal budgets.  
Affecting 192,647 train services and causing ~23,000 hours of total delay.  
7.5 million planned train services per year (ORR data)

The chance of any  train being hit by an equipment failure:  
192,647 ÷ 7,500,000 = ~2.6%

That's roughly 1 in 40 journeys

The average delay per affected train:  
23,000 hours ÷ 192,647 trains = ~7.2 minutes

For a daily commuter doing ~480 journeys/year:  
~12–14 short delays and ~7 longer ones from equipment failures alone

Part 2: Operational red signals (the signal works, but it's red anyway)  
This is where the signaller holds your train for traffic management.

On a busy commuter route like the Kingston loop, this happens on an estimated 15–25% of peak-hour journeys to some degree (derived estimate from ORR data)

Most are brief (1–2 minutes while a service clears ahead)

A hold of 3+ minutes happens on roughly 10–15% of peak journeys (derived estimate from ORR data)

The main hotspots: Clapham Junction (one of the busiest junctions in Europe), Wimbledon (convergence of multiple routes), and Waterloo approach (platform availability)

Off-peak, operational holds drop to roughly 5-8% of journeys

Part 3: Combined - my actual odds  
Equipment failure delay per journey: ~2.6% (1 in 40)  
Red signal hold per peak journey: ~15–25% (any hold), ~10–15% (notable)

Combined chance of any meaningful red signal stop (3+ min, peak): ~12–17%  
Combined chance of a completely smooth run (peak): ~72–82%

Over a commuting year (480 journeys): expect roughly 70–85 journeys with some kind of red signal hold, of which ~20 will be 10+ min.